Since the microfinance sector broadened its focus from loans to financial inclusion, savings have become a major focus. And rightly so – the argument for providing poor customers with a safe and reliable place is backed by both robust research and common sense. Meanwhile, MFIs are already delivering on the promise: in 2011, MIX Market reported nearly 80 million depositors world-wide, with an average balance of $994.
It's a great story. Unfortunately, it’s at least somewhat misleading. Simply put, when it comes to microsavings, objects in mirror may be larger than they appear.
 Recently, I have been working on a project with the Financial Access Initiative to map different business models of collecting deposits: do MFIs focus on managing large numbers of small accounts, a small number of large ones, or some hybrid of both? And what are the implications of these different approaches? This paper is forthcoming and has yielded some interesting insights. But one of the unexpected findings has been the issue of empty or near-empty accounts.
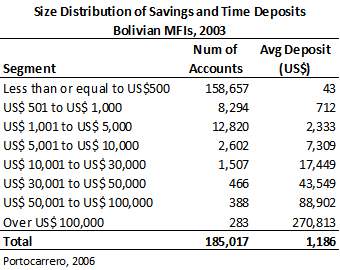
Consider the stratification of deposits of Bolivian MFIs included in a 2006 paper exploring how MFIs can fund themselves, including via deposits. Back then, Bolivian MFIs had 185,000 savings accounts, with an average balance of $1,186. But that average obscured an important detail – the vast majority of accounts (86%) were well below $500, averaging $43.
What to make of this figure? In Bolivia in 2003, $43 was far less than most microfinance loans – that year, the lowest average loan balance ($146) was reported by Pro Mujer. BancoSol, the leading MFI in the country had an average loan balance of $2,126. Still, comparing loans and savings does not say very much. One can certainly imagine that a poor family that was able to save $43 at their MFI was deriving some benefit from the opportunity.
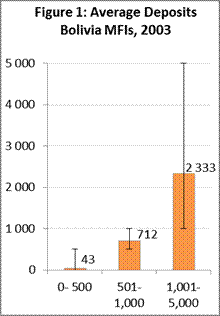
But that’s not the whole story. That figure –$43 – is an average of loans that range in size from $0 to $500. And because it’s so far removed from the midpoint of the range, it implies that the vast majority of those accounts were below $43, in fact, far below. Compare, for example, the next two segments: $501-$1,000 and $1,001-$5,000. Distribution in both those cases is reasonably close to the midpoint. Yet this is not at all the case for the lowest segment (Figure 1). There is only one plausible explanation for such a distribution: the MFIs held on their books a large number of empty or near-empty accounts.
 That’s not a good thing for financial inclusion. Of course, some accounts may simply have a low balance at the time MFIs report their data. However, the large number of such accounts suggests that many of them are probably underused or not used at all, and they shouldn’t be counted as part of financial inclusion outreach.
So how many of the 80+ million deposit accounts reported by MFIs to the MIX are actually being used by clients? 60 million? 50 million? Given how MFIs report their deposits, we cannot know with any certainty, though one can make reasonable estimates. Here at e-MFP, we are currently exploring mechanisms to do just that, and we expect to publish the results of this research in the near future. However, that is only a tool for understanding the issue.
Financial inclusion is a worthy and appropriate goal for the microfinance sector. But if we are to deliver on our promises, we cannot build up another story that cannot be backed up with facts. We must develop and implement better tools for reporting data on savings outreach. Otherwise, what we show will still be seen through that mirror, where savings are larger than they appear and real outreach is beyond reach.


Leave a comment