Originally published by NextBillion
 The publication of the 2017 Global Findex has generated much reflection on the state of financial inclusion – and plenty of analysis of the data, looking for the buried treasure of some new trend or pattern. This yields important insights. The Financial Inclusion Hype vs. Reality report by the Center for Financial Inclusion (CFI) is particularly worth reading for its in-depth and honest reflection of what Findex tells us.
But when using Findex, there are important things to keep in mind. First, while the overall figures and trends are important, the numbers for any one country should be treated with caution. This is not because we mistrust the Findex team or their work. It’s simply the result of what Findex is – a set of surveys based on randomly selected (hopefully representative) population samples of more than 150,000 adults in over 140 economies. And surveys can – and often do – go wrong, particularly when they deal with difficult or personal subjects (like finance) or are conducted in countries undergoing political and economic turmoil.
This reality forms the backdrop of our work at the Microfinance Index of Market Outreach and Saturation (MIMOSA) project, which since last year has been supported by a strategic partnership with e-MFP. A huge part of MIMOSA is collecting and comparing data – from credit bureaus, microfinance and banking associations, central banks, third-party surveys like Findex, and our own field surveys. We have now done this in 10 different countries. Certainly, 10 countries is not 140, and that’s where Findex continues to play a key role in this process – it’s the only resource that genuinely covers the world. But our work has given quite a different perspective on the financial inclusion trends Findex is highlighting. Let’s look at a few examples.
‘Shy Borrowers’ = Big Data Discrepancies
In MIMOSA’s work, using data from a credit bureau in Peru in 2015, we found 26 percent of adults to be borrowers from formal institutions, such as banks, credit cooperatives and microfinance institutions (the measure of “credit penetration”). Meanwhile, in its findings on Peru, Findex reports these figures as 11.2 percent and 14.7 percent in 2014 and 2017 respectively. Similarly, in our 2018 Nicaragua report, relying on data from the central bank and the microfinance supervisory body, we calculate credit penetration of 18 percent, which increased significantly from 2014. Findex reports 11 percent credit penetration in the country, with a significant decrease since 2014.
When a survey captures fewer borrowers than the number reported by the lenders, the survey is probably missing the “shy borrowers” – people who are reluctant to discuss their borrowing history with a stranger, whether on the phone or in person. The practice appears especially prevalent in some Latin American countries with active credit markets. For example, we have not done a MIMOSA report on Mexico, but the country’s 5.8 percent loan penetration rate reported by Findex is simply not believable, placing Mexico – well known for its very active and competitive credit markets – at the same level of credit penetration as countries with far less developed credit markets, like Mali.
The problem is not limited to Latin America. In Morocco, our field survey in 2016 found high reluctance among people to even talk about credit, let alone acknowledge having borrowed themselves. Part of this is religious, following Islamic teachings that prohibit lending on interest, and part is cultural. But whatever the reason, the result is that Findex reports credit penetration in Morocco at 2.6 percent, among the very lowest in the world. Yet its credit bureau shows 10.1 percent of adults having active loans.
And what about Bangladesh, the “cradle of microfinance”? Findex shows an inexplicable drop from 23.3 percent credit penetration in 2011 down to just 9.1 percent in 2017. Yet simply combining the current active loan portfolios of its three largest MFIs implies a credit penetration of nearly 20 percent, and that doesn’t include any other MFIs, banks or other formal lenders. Of course, individuals may hold multiple loans (and MIMOSA has developed a well-tested technique for estimating this practice in the absence of good data), but even the most generous allowance for multiple borrowing cannot account for such a large disparity in Bangladesh between Findex and lender data.
The Fickle Nature of Survey-Based Data
Under-reporting of credit by “shy borrowers” is one scenario where a survey like Findex can go wrong, but over-reporting is also possible. Our current work in Jordan identified approximately 560,000 recent MFI and bank borrowers in the country, representing 8.4 percent of the adult population. Findex reports 16.6 percent, implying about 1 million borrowers instead. Where do all these additional borrowers come from? At least part of the explanation comes from Findex’s sampling. In its methodology, Findex notes that 12 percent of the survey respondents were non-Jordanians. And yet, according to the 2015 census, non-Jordanians (migrants, refugees and others) make up 33 percent of the country’s population, and a recent survey in Jordan conducted by GIZ and BFC found that these households are seven times less likely to borrow from financial institutions than Jordanian citizens. Findex’s under-sampling of these non-citizen residents is one likely reason for the inflated level of credit penetration reported by the survey.
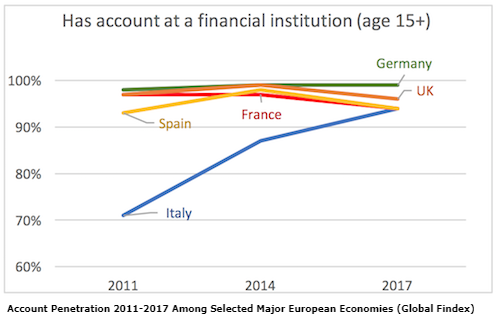 MIMOSA deals mainly with credit penetration, and so all the above examples come from our work. But deviations on other indicators are also possible. There is at least one example concerning the most basic inclusion metric – possessing a bank account – that stands out as remarkably odd. According to Findex data, one of the great financial inclusion success stories of the past six years turns out to be Italy. Yes, Italy – where, according to Findex, account ownership grew from 71 percent to 94 percent between 2011 and 2017. Italy is literally the country where banks were invented. Nothing during this brief period of its storied 600-year banking history accounts for this major shift. Instead, according to the Bank of Italy, the number of bank deposit accounts has grown by 11 percent during the same period, and it’s likely that growth among newly included individuals is substantially lower, given that this growth includes commercial accounts and multiple accounts held by the same individuals (the number of deposit accounts actually exceeds Italy’s entire population, including children). The 2017 figure of 94 percent is probably about right, and in line with other major European countries, but for whatever reason, in both prior years (2011 and 2014), Findex recorded a significant undercount. Just one more example of the fickle nature of survey-based financial data.
The Deeper Value of Findex
Does that mean that Findex should be ignored altogether? No. Indeed, there are some aspects of financial practices that can only be captured by surveys: reasons for not opening accounts, for example, or use of various informal financial products. Likewise, the CFI analysis does a wonderful job of capturing an element that is both notable and real – the growth in the number of bank accounts that go unused. That too, though, can be validated by hard (non-survey) data.
Over the years we at MIMOSA have grown less reliant on Findex data, focusing increasingly on our own database of verified data from 10 countries and counting. Still, a large, multi-year dataset like Findex is invaluable, and will remain so even for the MIMOSA project. Until a better approach comes along, the only way to create a 140-country, multi-year dataset will be through a survey.
But it’s important to use such survey data carefully, recognizing that it can contain significant departures from the truth – departures that themselves can often point to important factors, such as the presence of “shy borrowers” or widespread social discomfort with debt. The Global Findex is valuable not only in those countries where its data is right, but also when its findings produce the kinds of gaps and inconsistencies described above. In those cases, recognizing the gaps can spur further investigation towards what is ultimately the goal of all researchers: the truth.
Image credit: Martin Fisch, via Flickr.

Leave a comment