 Back in May, and only a few weeks after the release of the 2017 Global Findex, the World Bank launched the 2018 SDG Atlas. Perhaps less well known than the Findex, the Atlas of Sustainable Development Goals is an even more massive endeavour, drawing on the Bank’s World Development Indicators (WDIs), a database of over 1,400 indicators for more than 220 economies, many going back over 50 years.
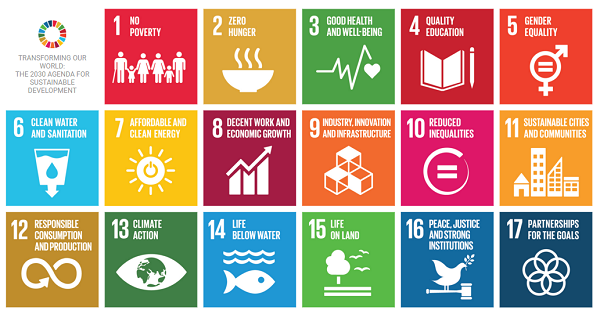
The ‘SDG’s in the title are of course the Sustainable Development Goals - the post-2015 follow up to the Millennium Development Goals that served as the target-based development architecture for the past decade or so. The SDGs provide a variety of targets across different areas of human development to be achieved by 2030. This is the UN General Assembly-adopted “2030 Agenda for Sustainable Development”, which extends the MDGs but also makes key adjustments, incentivising collective action by all countries.
There are 17 goals that make up the (often criticised) SDGs. It’s been widely observed that the delicate and lengthy process of negotiation and compromise that produced the SDGs ended up with no SDG that specifically addresses financial inclusion. Nevertheless, the explanatory materials that support the 17 SDGs (and their many sub-components) clearly acknowledge that greater access to financial services is a key enabler for many of them.
How does FI fit within the SDGs?
The role of financial inclusion in the SDGs is clear. Five of the 17 Goals mention financial inclusion, including No Poverty (SDG1), Zero Hunger (SDG2), Good Health and Well-Being (SDG3), Gender Equality (SDG5), and Decent Work and Economic Growth (SDG8). Financial inclusion can be the key tool that is uniquely effective in mitigating poverty, hunger, gender inequality, lack of access to education, and the like. Account ownership promotes gender equality. Agri-finance promotes investment in planting, technology and transportation that drives yields and security. Microinsurance protects vulnerable people from health shocks. Housing microfinance affects, well, probably everything.
So financial inclusion is embedded into the SDGs. What does the latest SDG Atlas, within its vast array of development indicators and data sets, have to say about the progress being made in inclusion?
Financial Inclusion in the SDG Atlas
The Global Findex is a unique (if limited) repository of country-level, survey-based financial inclusion data. The SDG Atlas is complementary to this resource, drawing its findings from the WDIs – the primary World Bank collection of development indicators, compiled from officially recognised international sources. Updated quarterly, it claims to present the most current and accurate global development data available, and includes national, regional and global estimates. The 2018 Atlas uses two primary methods for classifying and aggregating countries and economies, by income and by region.
Like with the Findex, the picture is mixed. We’ll look at a handful of selected SDG ‘targets’ that touch on financial inclusion.
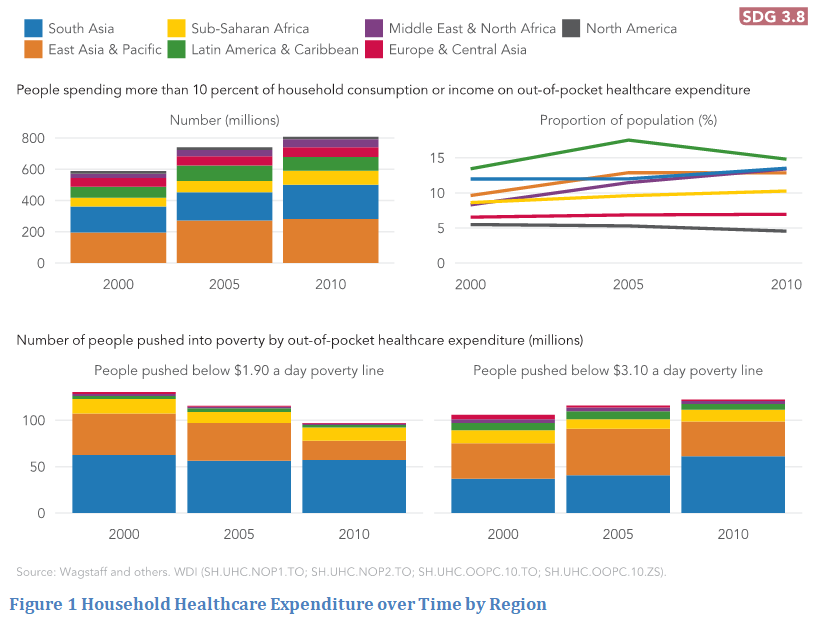
Access to finance for health care – savings, credit and in particular insurance – is a critical and growing part of the inclusion landscape. The Atlas data shows the precariousness of many poor families’ finances when it comes to health expenditure. Target 3.8 is to “achieve universal health coverage, including financial risk protection, access to quality essential health-care services and access to safe, effective, quality and affordable essential medicines and vaccines for all”. Yet in 2010, 800 million people spent over 10% of household budgets on healthcare, and 97 million were pushed into extreme poverty by health spending. Figure 1 shows absolute growth in those spending over 10%, and in those pushed below the $3.10 per day poverty line.
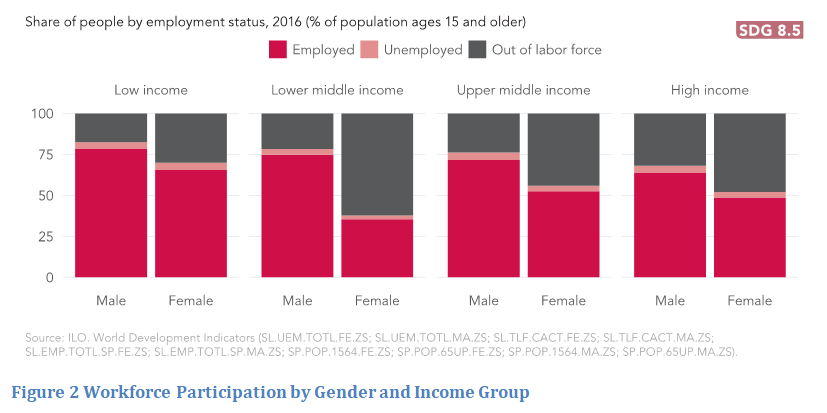
The persistence of the gender gap in financial inclusion was a headline (and fairly depressing) outcome of the most recent Findex, and deeper analysis of this has been done in several other places, including an excellent CFI report. Gender differences are embedded in employment too. The WDIs, reported in the Atlas, also show that globally women are less likely to be employed than men, and that this gap is most pronounced in low-middle-income countries. Figure 2 shows male versus female employment levels by income level. In poor countries, the existential threat of grave poverty may compel men to tolerate their wives and daughters working; above this lowest income level, however, culture mores prevail, and lower-middle income female workforce participation is barely at 30%.
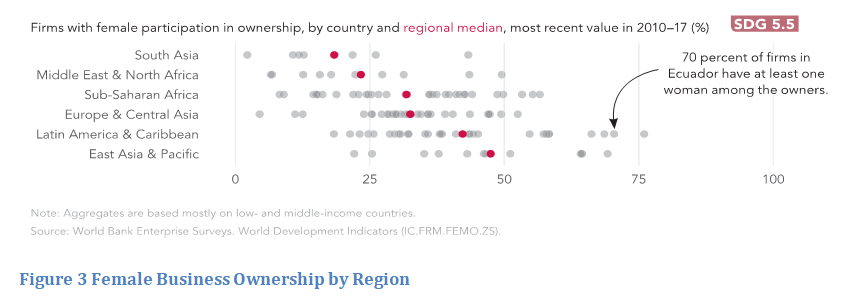
Moreover, in all regions, fewer than half of firms are even partially owned by a woman.
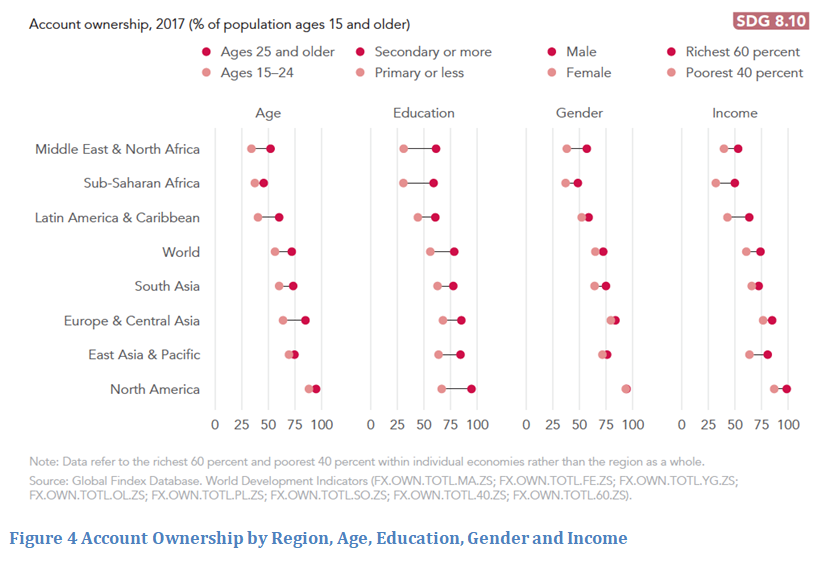
Yet it is in SDG 8 - Decent Work and Economic Growth – that the most financial inclusion-specific data emerges. Target 8.10 comprises the objective to “strengthen the capacity of domestic financial institutions to encourage and to expand access to banking, insurance and financial services for all”. Three years into the 15-year target timeframe, younger adults, women, the lower educated and the poorest continue to lag in account ownership. Nominal account ownership is increasing, driven both by specific government programs with no-frills accounts, and the cost reductions in outreach that FinTech offers to providers. Globally, 69% of adults now have an account with a financial institution or mobile money provider, showing some progress towards Target 8.10.
However, Figure 4 below, which incorporates Findex survey data into the WDI results, reveals pernicious gaps in account ownership by income quartile, gender and education level in MENA and SSA in particular – although education level remains a strong determinant in all regions.
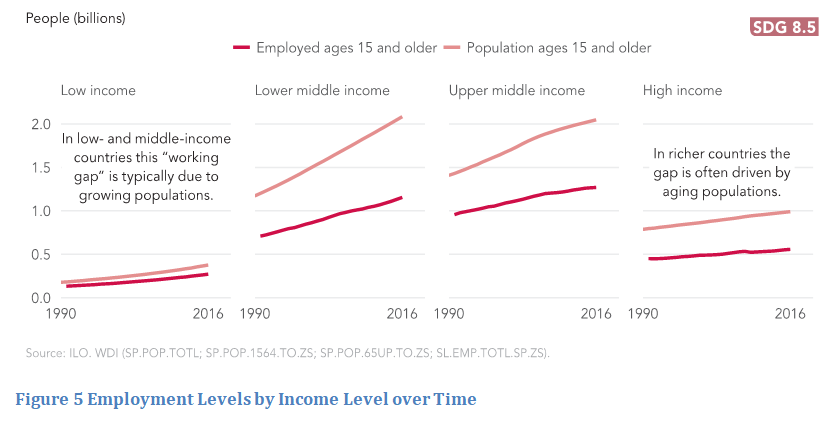
Finally, target 8.5 is, by 2030 “[to] achieve full and productive employment and decent work for all women and men, including for young people and persons with disabilities, and equal pay for work of equal value”. The WDIs show the persistence of the problem of un(der)employment, especially for the young – a problem exacerbated by demographic changes, including reduced birth rates, increased longevity and, as a result, a smaller share of the population working at any one time. Figure 5 shows growing ‘working gaps’ over time between total and employed population in all income groups, with the strongest gradient in the lower middle income group, as this segment expands from 1.1 to 2.1 billion people over 1990-2016, and job creation struggles to keep pace.
The SDG Atlas is an enormous project, much broader than the Global Findex with its focus on financial inclusion from primarily survey data. But there is some overlap where the SDGs touch – as they frequently do – on issues of financial exclusion, and the SDG Atlas, with its leveraging of a fantastically broad and deep array of data, offers a fascinating look at how international development is progressing against many different indicators. Despite its more general focus, it should be read alongside the Findex as a key resource in understanding the trends, progress and challenges in financial inclusion.

Leave a comment